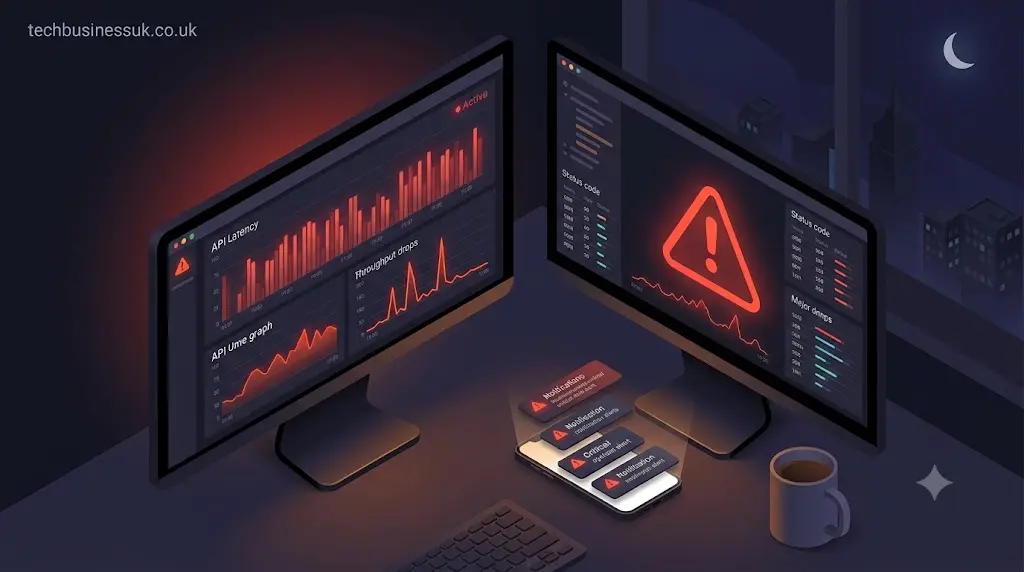
Your API passed every test. The code is clean. The documentation looks sharp. You push to production, grab a coffee, and call it a day. Then your phone rings late at night, right at 2 a.m. Customers cannot check out. Your payment API is down, and nobody noticed until angry tweets started flying.
That is the moment you realize testing is not enough.
In this guide, we will explain exactly what is API monitoring and why your team needs it running quietly in the background. We will walk through how it works, what metrics actually matter, and how it fits into the bigger picture of building reliable software. In the end, you will see how monitoring stops issues before users notice.
What Is API Monitoring?
So, what is API monitoring in plain English? It is the practice of continuously checking your API endpoints to make sure they are available, fast, and returning the correct data. Think of it as a health checkup that never stops. Instead of waiting for a user to complain about a broken endpoint, monitoring tools ping your APIs around the clock from different locations and alert you the second something looks off.
API monitoring goes deeper than a simple “is it up or down” check. A good monitoring setup watches response times, error rates, status codes, and even the structure of the data coming back. If your API usually responds in 200 milliseconds but suddenly jumps to five seconds, monitoring catches that trend. If your authentication endpoint starts throwing 401 errors at an unusual rate, you get an alert before your support inbox explodes.
It also helps you understand patterns. Maybe your API slows down every weekday at 3 p.m. when a batch job runs. Maybe error rates spike during your nightly backup window. These patterns are invisible without monitoring. Once you see them, you can plan fixes instead of fighting fires.
Understanding this concept also means knowing what it is not. It is not testing. Testing happens before release. Monitoring happens after. Testing asks, “Does this code work under these conditions?” Monitoring asks, “Is this endpoint working fine in production right now?” Both are essential. Neither replaces the other.
Why API Monitoring Matters
Here is the truth nobody wants to hear: production is messy. Traffic spikes happen. Third-party services fail. Database connections timeout. Certificates expire on weekends. Without monitoring, you are essentially flying blind and hoping nothing breaks.
API monitoring gives you visibility. It turns invisible problems into visible data. When your latency graph spikes at 3 p.m. every Tuesday, you start asking questions. Maybe a batch job is hammering your database. Maybe a partner integration is polling too aggressively. Monitoring does not fix the problem for you, but it hands you the map.
For businesses, the stakes are real. A slow API does not just annoy developers. It costs money. Studies show that even a one-second delay in response time can hurt conversions. In industries like fintech, healthcare, or e-commerce, an outage can mean regulatory headaches, lost revenue, and damaged trust. Monitoring is not a luxury. It is insurance.
It also protects your reputation. Developers talk. If your API is unreliable, word spreads fast in forums and Slack channels. Good monitoring helps you catch issues early, communicate transparently with users, and maintain confidence in your service.
API Monitoring vs. API Testing
These two are easy to confuse, so let’s explain the difference. API testing is about validation. You write test cases, send requests, and verify responses against expected results. You check that your authentication flow works, that your data validation rules trigger correctly, and that edge cases are handled gracefully. Testing is proactive. It happens in staging, in CI pipelines, and on developer machines.
API monitoring is reactive and continuous. It watches the live system. It does not care about your test cases. It cares about reality. Are your endpoints responding? Are they responding fast enough? Are they returning the right status codes to real requests?
The best teams use both. They lean on robust API testing tools to catch bugs before deployment, then layer on monitoring to catch the surprises that only show up under real-world load. If you want to build a solid quality strategy, start with testing, but never stop at testing. You need eyes on production too.
Testing tells you if your code is correct. Monitoring tells you if your system is healthy. Put them together to see everything.
How API Monitoring Connects to API Gateways
Your API gateway is the front door of your application. It handles authentication, rate limiting, smart routing, and traffic management. It is also the perfect place to gather monitoring data. Every request that hits your system passes through the gateway first, which means the gateway sees everything.
API monitoring and API gateways work hand in hand. Gateways generate logs and metrics. Monitoring tools consume those metrics and turn them into alerts and dashboards. If your gateway starts rejecting requests because of rate limiting, monitoring shows you the spike. If your gateway’s SSL certificate is about to expire, monitoring warns you in advance.
Some gateways come with built-in monitoring dashboards. Those are helpful, but they are usually limited. Dedicated monitoring tools give you deeper insights, historical trends, and the ability to correlate API performance with business metrics. The gateway handles the traffic. Monitoring tells you how that traffic is behaving. Together, they give you full visibility into your API layer.
When something goes wrong, the gateway logs and monitoring alerts are your first two stops. One tells you what happened. The other tells you how bad it is.
Key Metrics to Track
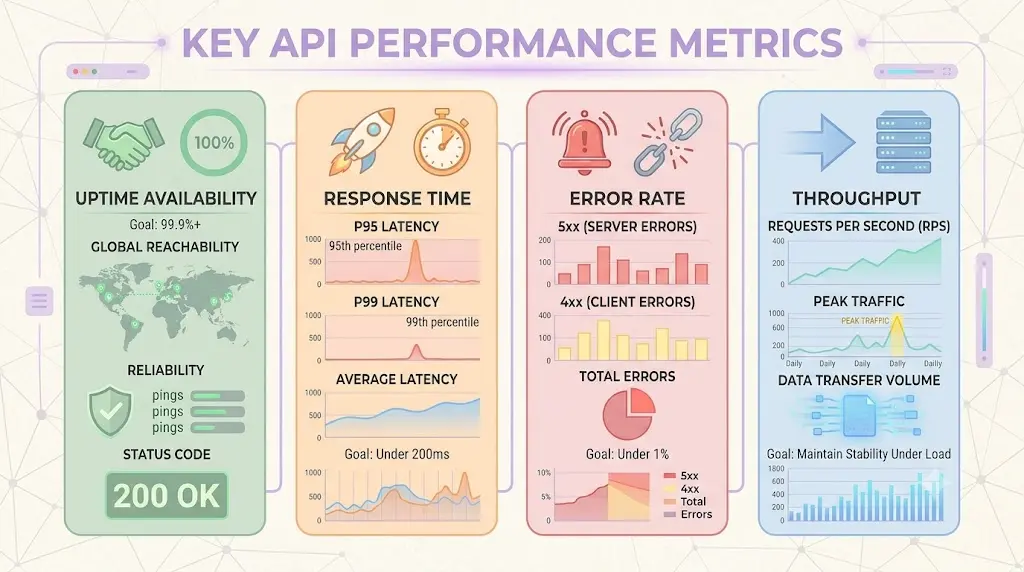
Not all metrics are created equal. If you are just getting started, focus on these four.
Uptime and availability. This is the big one. Is your API reachable? Monitoring tools ping your endpoints at regular intervals from multiple locations. No 200 OK status code means the API is down. We don’t count partial successes or weird errors as uptime. Aim for 99.9 percent uptime or better, depending on your service level agreements.
Response time. Speed matters. Track the average response time, but also track percentiles. Your average might look fine at 300 milliseconds, but your 95th percentile could be sitting at three seconds. That means some users are having a terrible experience. Monitoring helps you spot those hidden slowdowns.
Error rate. Keep an eye on the percentage of requests that return 4xx or 5xx status codes. A sudden jump in 500 errors usually means something broke on your end. A spike in 401 or 403 errors might indicate an authentication issue or even an attempted attack.
Throughput. How many requests is your API handling per minute or per second? This helps you understand traffic patterns and plan capacity. If throughput doubles overnight, you need to know whether your infrastructure can handle it or if you need to scale.
Types of API Monitoring
There is more than one way to watch an API. Here are the main approaches.
Synthetic monitoring. This is the most common type. A monitoring tool sends scripted requests to your API at scheduled intervals, say every minute from five different cities. It checks response time, status code, and payload structure. Synthetic monitoring is predictable and reliable, but it only tells you what the tool sees, not what real users experience.
Real user monitoring. This approach captures data from actual API calls made by your applications and users. It gives you a more accurate picture of real-world performance, including geographic variations and device-specific issues. The downside is that it requires instrumentation in your client applications..
Security monitoring. APIs are a common attack surface. Security monitoring watches for unusual patterns, such as repeated failed login attempts, abnormal traffic volumes, or requests from suspicious IP ranges. It helps you detect and respond to threats before they escalate.
Each type serves a different purpose. Most teams start with synthetic monitoring because it is easy to set up. Then they add real user monitoring and security monitoring as their needs grow.
API Monitoring Best Practices
Getting started is easy. Doing it well takes a little more thought.
Monitor from multiple locations. Your API might be blazing fast from your office in London and painfully slow for users in Singapore. Use monitoring tools that check from different geographic regions to get a global view.
Set meaningful alert thresholds. Do not alert on every tiny blip. If you wake up your team for a 50-millisecond spike that resolves in 30 seconds, they will start ignoring alerts. Focus on sustained issues or trends that actually impact users.
Test your alerts. An alerting system that fails silently is worse than no alerting system at all. Regularly verify that notifications actually reach the right people through the right channels.
Correlate with gateway logs. When monitoring flags an issue, your API gateway logs can tell you why. Did a specific service fail? Was there a traffic spike from a particular client? Connecting monitoring alerts to gateway data speeds up debugging dramatically.
Monitor third-party APIs too. If your application depends on external APIs, monitor them as well. You cannot fix their infrastructure, but you can know immediately when their outage is affecting your users.
Keep historical data. Trends matter more than single data points. A response time that creeps up slowly over three weeks is a warning sign. Without historical data, you will miss it.
Document your runbooks. When an alert fires at 3 a.m., your on-call engineer needs clear steps. A good runbook turns a panic into a process. It should explain what the alert means, how to verify it, and what actions to take.
API Monitoring in Practice
Let us bring this down to earth. Imagine you run a subscription service. Every morning at 9 a.m., your billing API processes a wave of renewal requests. One Monday, your monitoring dashboard shows a spike in response time right at 9:05. You check your API gateway logs and see that a database connection pool is maxed out. You scale the pool, the response time drops, and your customers never even notice there was a problem.
That is monitoring in action. It is not magic. It is simply paying attention to the right signals at the right time. It turns “we think everything is fine” into “we know everything is fine.”
Another example: your team pushes a minor update on a Friday afternoon. The tests pass. The deploy succeeds. But over the weekend, monitoring shows a slow climb in 500 errors from one specific endpoint. You roll back on Sunday evening instead of discovering the problem Monday morning when your users flood support. Monitoring bought you time.
Conclusion
So, what is API monitoring? It is your always-on safety net. It is the difference between finding out about a problem from an angry customer and finding out from a dashboard alert while you still have time to fix it.
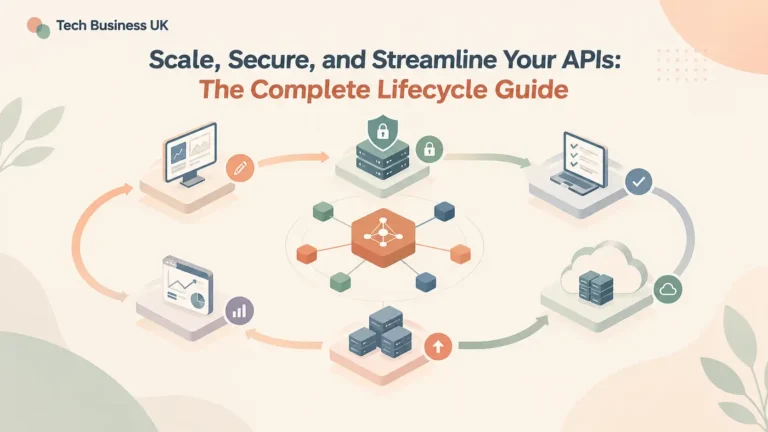
If you are serious about API reliability, start with solid testing during development, configure your API gateway to handle production traffic intelligently, and then add continuous monitoring to watch everything in real time. The combination of testing, gateway management, and monitoring gives you confidence that your APIs will not just work on launch day, but every day after that.
Start small. Pick your most critical endpoint. Set up a simple synthetic check. Watch the data for a week. Once you see the value, expand from there. Because in the world of APIs, what you do not monitor will eventually become what you do not know until it is too late.
For a deeper look at how Google approaches API monitoring and observability, check out their official Cloud Monitoring documentation.
Frequently Asked Questions
1. What’s the actual difference between API testing and API monitoring?
Testing happens before you launch. You run tests in your development environment to see if your code works properly under test conditions. Monitoring happens after you deploy. It continuously checks your live API in production to make sure real users aren’t running into unexpected bugs, timeouts, or downtime.
2. Should I set up synthetic monitoring or real user monitoring first?
Start with synthetic monitoring. It’s much easier to set up because a tool simply sends fake, automated requests to your API every minute to check if it’s up and running. Once your app grows and gets heavy traffic, you can add real user monitoring to track how actual people are experiencing your API on their own devices.
3. What are the main metrics I should look at every day?
Keep it simple and focus on four main things:
- Uptime: Is the API reachable right now?
- Speed: How fast is it responding to requests?
- Error Rate: How many requests are failing with 4xx or 5xx error codes?
- Traffic (Throughput): How many requests is your API handling per second?
4. Do I really need a separate monitoring tool if I already have an API gateway?
Yes. Your API gateway is like the front desk—it routes traffic and collects basic logs, but its main job is managing traffic, not analyzing it. A dedicated monitoring tool takes those logs from the gateway and turns them into visual charts, long-term performance trends, and instant alerts when something breaks.
5. How do I stop my team from getting overwhelmed by false alarm alerts?
Don’t set alerts for every minor blip. If your API takes 10 milliseconds longer to respond for a single request, nobody needs to wake up at 2 a.m. Set alert thresholds for sustained problems—like when your error rate stays high for more than two minutes or an endpoint completely stops responding.
About the Author