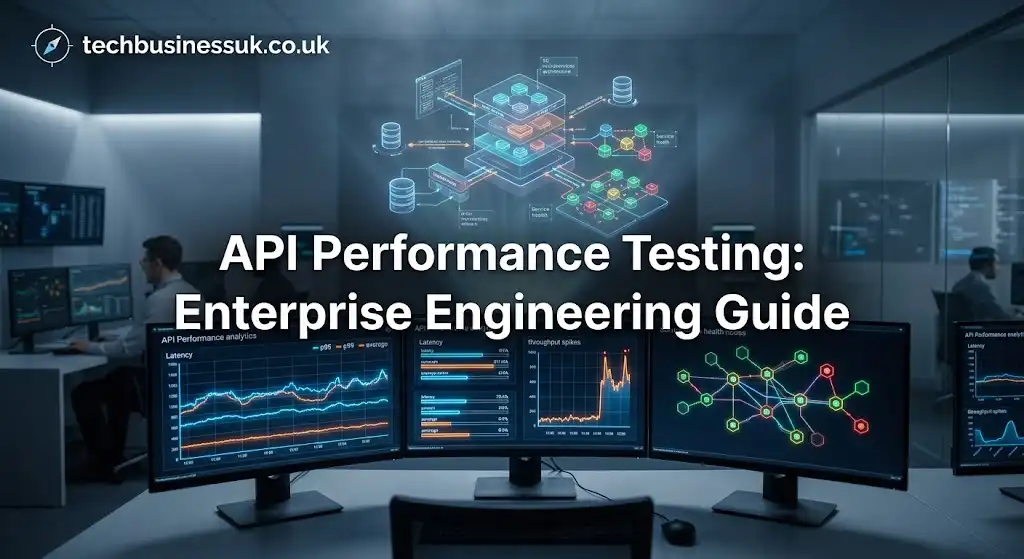
Building high-throughput, resilient web services requires a complete shift from basic functional validation to rigorous API performance testing. Delivering modern microservices and cloud-native applications means that an endpoint responding with an HTTP 200 OK status code is only half the battle. If that response takes 4 seconds under a moderate traffic load, your application is broken in the eyes of your users.
In modern enterprise architectures, every millisecond of network latency and server overhead directly impacts bottom-line revenue, system resilience, and brand reputation. An unoptimized API route, a silent memory leak, or a blocking database query can quickly cascade through an entire ecosystem, bringing down downstream services and creating widespread outages.
This comprehensive guide breaks down the core methodologies, technical metrics, tooling ecosystems, and architectural fixes required to build an enterprise-grade API performance testing suite.
1. The High Cost of Unmonitored API Latency
In modern distributed platforms, APIs are no longer internal helper functions—they are the core nervous system of modern software. When microservices communicate across complex networks, latency compounds exponentially. A single user interaction on a modern frontend might trigger dozens of synchronous or asynchronous backend calls across multiple service boundaries.
Plaintext
[ Client Application ]
         |
         +---> ( GET /api/v1/user/profile )  <-- 150ms
         |
         +---> ( GET /api/v1/orders/active ) <-- 850ms (BOTTLENECK)
         |
         +---> ( GET /api/v1/notifications ) <-- 90ms
If one dependent endpoint experiences a sudden degradation in response time, the entire user interface freezes, worker threads back up, connection pools drain, and cascading failures ripple across your infrastructure.
Functional Correctness vs. Performance Under Pressure
Functional testing validates behavioral expectations under static, isolated conditions:
- Does the API accept the expected payload structure?
- Does it enforce correct authorization rules?
- Does it return the expected HTTP status codes and JSON schema?
Conversely, API performance testing evaluates operational durability across variable runtime stress conditions:
- How does the garbage collector behave when concurrency scales from 100 to 10,000 active connections?
- Do thread pools starve when third-party dependencies slow down?
- At what exact throughput threshold does the system begin dropping requests or emitting HTTP 503 Service Unavailable errors?
Failing to validate these operational parameters before pushing code to production leaves your organization vulnerable to costly outages, missed Service Level Agreements (SLAs), and skyrocketing cloud compute bills caused by misconfigured autoscaling policies.
2. Key Types of API Performance Testing
To build a resilient service, engineering teams must execute distinct performance testing profiles. Each testing profile targets a specific vulnerability in your infrastructure, application code, or database layer.
Plaintext
+-----------------------------------------------------------------------+
|                    PERFORMANCE TESTING MATRIX                         |
|                                                                       |
|  LOAD TESTING      --> Validates normal & peak SLA compliance         |
|  STRESS TESTING    --> Pinpoints structural breaking points           |
|  SPIKE TESTING     --> Assesses autoscaling & buffer resilience       |
|  SOAK TESTING      --> Uncovers memory leaks & resource decay         |
|  SCALABILITY TEST  --> Verifies linear resource efficiency            |
+-----------------------------------------------------------------------+
Load Testing
Load testing evaluates baseline performance under expected operational conditions. Engineering teams simulate anticipated daily traffic volumes, alongside forecasted peak usage windows (such as a planned marketing campaign or seasonal activity spikes).
- Primary Objective: Verify that response times, throughput rates, and error frequencies stay strictly within predefined SLA boundaries during peak business hours.
- Execution Strategy: Ramp virtual users smoothly up to target capacity, hold the load steady for a defined duration (e.g., 30 to 60 minutes), and monitor system stability.
Stress Testing
Stress testing pushes an API past its designed capacity until it breaks. The goal is not to demonstrate that the API functions smoothly, but rather to identify its absolute limits and analyze how gracefully it fails under extreme load.
- Primary Objective: Identify structural bottlenecks (such as database connection limits, thread starvation, or CPU saturation) and confirm that the system recovers cleanly without requiring manual engineering intervention.
- Key Focus: Does the system fail gracefully by serving structured error messages and shedding load, or does it suffer hard memory crashes and corrupt state?
Spike Testing
Spike testing exposes the target system to sudden, violent surges in incoming traffic. Rather than gradually ramping up virtual users over several minutes, spike tests introduce rapid traffic spikes in a matter of seconds.
- Primary Objective: Test network buffer queues, rate limiting policies, auto-scaling trigger speeds, and cold-start performance (such as serverless container provisioning).
- Real-World Parallel: Flash sales, breaking news alerts, or sudden marketing notifications pushing millions of concurrent users to a single checkout or login endpoint simultaneously.
Soak (Endurance) Testing
Soak testing involves applying a moderate, sustained load over an extended time window—typically ranging from 12 to 24 hours. While an API might perform flawlessly during a 15-minute load test, long-running processes often reveal hidden system vulnerabilities.
- Primary Objective: Uncover slow memory leaks, unclosed database cursor connections, log file disk exhaustion, thread pool leaks, and state degradation that only manifest over time.
- Critical Metric: Monitoring long-term memory allocation curves to ensure heap consumption returns to baseline after garbage collection cycles, rather than creeping steadily upward until an Out-Of-Memory (OOM) error occurs.
Scalability and Volume Testing
Scalability testing evaluates the system’s ability to scale resources horizontally or vertically in proportion to increasing request volumes. Volume testing specifically measures how APIs handle large dataset processing—such as querying database tables containing hundreds of millions of rows or parsing massive multi-megabyte request payloads.
- Primary Objective: Verify that doubling compute resources yields a proportional increase in transaction throughput, ensuring that your software architecture exhibits linear scalability rather than exponential cost growth.
3. Core Technical Metrics You Must Measure
Relying on simple arithmetic averages (such as average response time) is one of the most dangerous mistakes in software performance engineering. Averages mask extreme latency outliers, concealing poor user experiences behind deceptively smooth summary metrics. To understand why tracking p95 and p99 percentiles is critical over simple averages, refer to the Google Cloud SRE Book on Monitoring Distributed Systems.
Plaintext
Distribution of API Latency (10,000 Requests)
+-----------------------------------------------------------------------+
| [90% of Users: 45ms] [5% of Users: 120ms]  |  [5% Outliers: 3,500ms]  |
| <--- Looks Great in Averages (Avg: 215ms) ---> | <-- Broken Experience  |
+-----------------------------------------------------------------------+
Response Time vs. Latency
While often used interchangeably, performance engineers distinguish between network transit latency and processing time:
- Latency (Network Delay): The time required for a packet to travel across the network from the client to the server, plus the time taken for the response packet to return.
- Server Processing Time: The duration the application server spends reading the request, executing business logic, querying datastores, and generating the HTTP payload.
- Total Response Time: The complete elapsed time from the moment the client dispatches the HTTP request until the final byte of the response body is received
Total = Latency + Processing.
Percentiles (p90, p95, p99)
To capture the true user experience across all traffic segments, performance metrics must be analyzed using statistical percentiles:
- p50 (Median): Represents the median transaction speed. Exactly 50% of requests were faster than this value, and 50% were slower.
- p95 (95th Percentile): Highlights the response time experienced by the slowest 5% of your user base. It filters out minor network blips while exposing systemic performance issues.
- p99 (99th Percentile): Uncovers severe edge-case latency. In high-throughput environments processing millions of daily requests, a poor p99 score means thousands of active users are experiencing unacceptable slowdowns.
Throughput: RPS and TPS
Throughput measures the total volume of work processed by the API per unit of time:
- Requests Per Second (RPS): The raw count of individual HTTP requests (such as GET, POST, or DELETE) handled by the system per second.
- Transactions Per Second (TPS): The count of complete business transactions completed per second. A single business transaction (e.g., Completing an E-Commerce Checkout) might require multiple underlying HTTP API calls executed in sequence.
Error Rates and Status Code Distributions
Performance metrics must always be correlated with HTTP status code distributions. An API that suddenly reports a fast 10ms response time under high load might actually be failing—returning HTTP 500 Internal Server Error or 503 Service Unavailable responses immediately rather than processing the request.
- Target SLA Metric: Total HTTP error responses (4xx client errors and 5xx server errors) should remain below 0.1% of total request volume during standard operational load tests.
4. Architectural Bottlenecks and Remediation Strategies
When an API performance test uncovers unacceptable latency or throughput degradation, performance engineers must isolate the root cause across the application layer, infrastructure configuration, or datastore architecture.
Plaintext
+-----------------------------------------------------------------------+
|                   COMMON PERFORMANCE BOTTLENECK MAP                   |
+-----------------------------------------------------------------------+
| LAYER             | COMMON ROOT CAUSE         | REMEDIATION STRATEGY  |
+-------------------+---------------------------+-----------------------+
| Database          | N+1 Queries, Missing Index| Caching, Read Replicas|
| Serialization     | Heavy JSON Parsing        | Protocol Buffers/gRPC |
| Concurrency        | Thread Pool Starvation    | Async / Event Loop    |
| Infrastructure    | Unbounded Payload Sizes   | Rate Limiting & Page  |
+-----------------------------------------------------------------------+
Database Query Inefficiencies
Databases are frequently the single biggest bottleneck in API performance testing. Common database issues include:
- N+1 Query Patterns: Executing one primary query to fetch N records, followed by N additional sub-queries to fetch related child data, creating exponential database round-trips.
- Missing Database Indexes: Forcing full table scans across millions of rows to serve simple
WHEREorORDER BYclauses. - Uncached Hotspots: Repeatedly querying static or slow-changing data (such as site configuration or product catalog metadata) from primary disk storage on every request.
Remediation: Implement distributed caching using Redis or Memcached, optimize SQL indexes, enforce query read-replicas, and consolidate queries using explicit database joins.
High Payload Overhead and Serialization Costs
Parsing large, deeply nested JSON structures introduces significant CPU overhead, string allocation cost, and network bandwidth consumption.
Remediation: Implement strict pagination (limit and offset or cursor-based pagination), support field filtering (allowing clients to request only required JSON keys), or upgrade high-frequency internal microservice communication from REST/JSON to lightweight binary formats like gRPC or Protocol Buffers.
Rate Limiting and Traffic Management Misconfigurations
Without proper edge protections, uncontrolled traffic surges can quickly saturate upstream application servers. Integrating explicit rate limiting policies ensures that your API infrastructure sheds excess load before backend worker threads become exhausted. To implement standardized client throttling responses when limits are reached, review the IETF RFC 6585 specification on HTTP status codes.
For a comprehensive guide on implementing robust security, token buckets, and rate-limiting rules at your network perimeter, explore our detailed resource on API rate limiting guide. Protecting your perimeter with proper rate-limiting architecture guarantees that performance testing validates internal business logic rather than diagnosing perimeter denial-of-service conditions.
Thread Starvation and Blocking Synchronous I/O
In synchronous, thread-per-request application architectures (such as traditional WSGI or Java servlet runtimes), every incoming request occupies an execution thread until processing completes. If an upstream external API dependency slows down, worker threads block indefinitely, exhausting thread pools and causing incoming requests to queue up and time out.
Remediation: Transition heavy I/O operations to non-blocking asynchronous architectures (such as Python’s asyncio/FastAPI, Node.js event loops, or Go goroutines) to decouple request handling from thread starvation.
5. Modern API Performance Testing Toolchain
Selecting the right testing tools depends on your tech stack, CI/CD setup, team skill sets, and throughput target requirements. Using standard, reliable api testing tools allows developers to write test scripts directly in code, ensuring performance validation stays embedded throughout the software development lifecycle.
Plaintext
+-----------------------------------------------------------------------+
|                    PERFORMANCE TESTING TOOL MATRIX                    |
+-----------------------------------------------------------------------+
| TOOL       | SCRIPTING LANG | PRIMARY USE CASE                        |
+------------+----------------+-----------------------------------------+
| Grafana k6 | JavaScript     | Developer-centric, CI/CD pipeline automation|
| JMeter     | GUI / Java     | Legacy enterprise, multi-protocol suites|
| Locust     | Python         | Complex, highly dynamic user flows       |
| Gatling    | Scala / JS / Java| Ultra-high throughput, async load generation|
+-----------------------------------------------------------------------+
1. Grafana k6
k6 is a modern, developer-centric, open-source load testing tool built in Go, designed specifically for high-performance automation. Tests are authored in standard JavaScript, allowing developers to keep performance scripts version-controlled alongside application source code. For step-by-step instructions on setting up automated pass/fail criteria in JavaScript scripts, see the Grafana k6 official documentation on thresholds.
- Key Advantages: Extremely low memory consumption, CLI-native, fast execution, built-in assertion thresholds, and native integration with Grafana dashboards.
- Best Used For: Automated CI/CD performance testing gates and modern cloud-native engineering teams.
JavaScript
import http from 'k6/http';
import { check, sleep } from 'k6';

// Define automated SLA performance thresholds
export const options = {
  stages: [
    { duration: '30s', target: 50 },  // Ramp-up to 50 virtual users
    { duration: '1m', target: 200 },  // Scale load to 200 virtual users
    { duration: '30s', target: 0 },   // Ramp-down to 0
  ],
  thresholds: {
    http_req_failed: ['rate<0.01'],   // Error rate must stay below 1%
    http_req_duration: ['p(95)<250'], // p95 response time must stay under 250ms
  },
};

export default function () {
  const url = 'https://api.enterprise.domain/v1/resource';
  const payload = JSON.stringify({ category: 'financial_services' });

  const params = {
    headers: {
      'Content-Type': 'application/json',
      'Authorization': 'Bearer YOUR_TEST_TOKEN',
    },
  };

  const response = http.post(url, payload, params);

  // Validate response status and payload content
  check(response, {
    'status is 200': (r) => r.status === 200,
    'transaction successful': (r) => r.json().success === true,
  });

  sleep(1);
}
2. Apache JMeter
Apache JMeter is one of the most established performance testing tools in the software industry. Built on Java, JMeter features a feature-rich graphical user interface (GUI) alongside robust protocol support extending beyond HTTP/REST to include JDBC, SOAP, FTP, LDAP, and JMS message queues.
- Key Advantages: Unmatched protocol support, rich plugin ecosystem, and extensive enterprise adoption.
- Disadvantages: High memory footprint when generating heavy local traffic, complex XML script structures, and a steep learning curve for automated CLI execution.
3. Locust
Locust is an open-source, developer-friendly load testing framework where tests are written entirely in pure Python. Instead of relying on rigid XML or GUI configurations, engineers write standard Python code to simulate complex, multi-step user behaviors.
- Key Advantages: Pure Python syntax, clean real-time web dashboard, highly expandable for custom protocols, and straightforward scenario modeling.
- Best Used For: Data science, machine learning, and Python engineering teams seeking to simulate dynamic user journeys.
Python
from locust import HttpUser, task, between

class EnterpriseApiUser(HttpUser):
    wait_time = between(1, 3) # Simulate realistic user think-time

    @task(3)
    def fetch_user_dashboard(self):
        self.client.get(
            "/v1/dashboard",
            headers={"Authorization": "Bearer TEST_KEY"}
        )

    @task(1)
    def submit_data_payload(self):
        self.client.post(
            "/v1/records",
            json={"status": "active", "priority": "high"},
            headers={"Authorization": "Bearer TEST_KEY"}
        )
4. Gatling
Gatling is an open-source performance framework built on Akka and Netty, engineered explicitly for asynchronous, non-blocking I/O load generation. This architectural foundation enables Gatling to simulate massive concurrent traffic volumes using minimal hardware resources.
- Key Advantages: Exceptional throughput capacity per engine node, beautiful default HTML report generation, and native support for Java, Kotlin, Scala, and JavaScript scripting interfaces.
6. Step-by-Step Guide: Executing an Enterprise Performance Test
Executing a successful performance test requires a structured, repeatable strategy. Running uncalibrated load tests against misconfigured targets wastes compute resources and yields misleading performance data.
Plaintext
+--------------------------------------------------------------------+
|               PERFORMANCE TESTING EXECUTION LIFECYCLE              |
|                                                                    |
| Step 1: Define Concrete Business Benchmarks & SLAs                  |
| Step 2: Configure An Isolated Staging Environment                  |
| Step 3: Script Realistic Data Pipelines & Authentication           |
| Step 4: Execute Load Runs & Monitor Observability Dashboards       |
| Step 5: Isolate Bottlenecks, Remediate Code, & Re-test             |
+--------------------------------------------------------------------+
Step 1: Establish Performance Benchmarks and SLAs
Before writing test scripts, define explicit performance criteria alongside product and infrastructure stakeholders. Avoid vague targets like “the API should be fast.” Instead, formulate quantifiable requirements:
“The
/v1/checkoutendpoint must sustain 1,500 RPS for 30 minutes while maintaining a p95 latency under 200ms and an HTTP error rate under 0.05%.”
Step 2: Configure an Isolated Test Environment
Never run high-volume performance tests directly against production systems unless you are deliberately running controlled chaos engineering experiments. Conversely, running tests against under-provisioned developer laptops produces misleading results.
- Mirror Hardware Topology: Staging environments should mirror production CPU, memory, container configurations, and database specs as closely as possible.
- Isolate Network Conditions: Ensure background network traffic from other teams does not taint latency collection.
- Isolate Mock Dependencies: Use API virtualization tools to mock third-party external services (such as payment gateways) to avoid hit-rate limits or incurring third-party billing charges during load runs.
Step 3: Script Realistic Scenarios and Data Sets
Simulating 1,000 virtual users executing the exact same request with identical parameters against the exact same database ID introduces artificial caching benefits, masking real-world latency.
- Dynamic Data Parameterization: Feed dynamic test data—such as unique user IDs, randomized search strings, and dynamic payload values—into test scripts using CSV data sources or synthetic generators.
- Authentication Tokens: Pre-generate dynamic JWTs or API keys to simulate unique session contexts across virtual users.
- Realistic User Ramp-Up: Incorporate realistic think times (delays between consecutive client requests) and gradual user ramp-ups to mirror real human traffic patterns rather than executing artificial, synchronized request spikes.
Step 4: Execute Tests and Monitor Observability Dashboards
During test execution, monitor real-time metrics across application performance monitoring (APM) tools, server logs, and infrastructure dashboards (such as Datadog, Prometheus, or Grafana).
Plaintext
          REAL-TIME OBSERVABILITY MONITORING STACK
+------------------------------------------------------------------+
| APPLICATION METRICS   | p50, p95, p99 Latency, RPS, Error Rates   |
| INFRASTRUCTURE METRICS| CPU Usage, Memory Consumption, I/O Wait  |
| DATABASE METRICS      | Slow Query Logs, Active Connection Pools |
+------------------------------------------------------------------+
Watch closely for system knees—the exact throughput threshold where response latency suddenly spikes exponentially while transaction throughput plateaus, signaling thread contention or hardware resource saturation.
Step 5: Analyze Root Causes, Remediate, and Retest
When performance falls short of your SLAs, analyze collected telemetry to isolate the primary bottleneck:
- Did CPU usage hit 100% on application nodes, suggesting heavy serialization overhead or unoptimized algorithms?
- Did database active connection pools saturate while CPU usage remained low, indicating slow, unindexed database queries or thread locks?
- Did network I/O hit bandwidth limits?
Apply targeted architectural fixes, deploy the updated code to your staging environment, and re-execute the identical test script to verify performance improvements.
7. Automating Performance Testing in CI/CD Pipelines
To prevent performance regressions from creeping into production, API performance testing must be integrated directly into continuous integration and continuous deployment (CI/CD) pipelines. Waiting until end-of-quarter testing cycles to evaluate system performance forces engineers to dig through months of code changes to locate the source of a latency regression.
Plaintext
                               CI/CD AUTOMATION PIPELINE
+------------------------------------------------------------------------------------+
| Pull Request --> Code Build --> Unit Tests --> Automated k6 Load Test --> SLA Gate |
+------------------------------------------------------------------------------------+
                                                                              |
                                                      +-----------------------+-----------------------+
                                                      |                                               |
                                                      v                                               v
                                           [ SLA Met: Merge Code ]                [ SLA Failed: Block Build ]
Shift-Left Performance Testing
Shift-Left testing brings performance validation early into the developer workflow. Every time a developer opens a pull request, lightweight, automated performance scripts execute against ephemeral staging environments.
By establishing automated SLA gates in your CI/CD runner (e.g., GitHub Actions, GitLab CI, or Jenkins), you can automatically block code merges if a pull request increases p95 latency by more than 5% or introduces error regressions.
Continuous Observability and RAG System Monitoring
As modern enterprise software increasingly integrates generative AI, vector databases, and Large Language Model (LLM) endpoints into backend API pipelines, performance testing must adapt to evaluate specialized workflows. Large language model pipelines suffer from non-deterministic generation times, streaming token delays, and complex retrieval overhead.
Monitoring the overall health, latency, and output accuracy of AI-augmented API endpoints requires specialized frameworks beyond standard HTTP response timers. To explore how leading organizations monitor semantic quality, context retrieval speeds, and model reliability in production pipelines, review our dedicated guide on rag evaluation metrics. Combining standard API performance monitoring with specialized LLM observability guarantees that your enterprise AI applications remain both lightning-fast and factually accurate.
Furthermore, ensuring your entire cloud infrastructure complies with security standards during continuous deployment is crucial. To dive deeper into integrating automated policy checks, standards enforcement, and automated governance across your deployment pipelines, check out the comprehensive industry guide on software compliance testing.
8. Comparison Matrix: Performance Metrics vs. Functional & Security Protocols
Understanding how performance metrics align with functional and security testing paradigms helps engineering leaders build balanced quality assurance frameworks across their organizations.
| Evaluation Dimension | Functional API Testing | API Performance Testing | API Security & Compliance Testing |
|---|---|---|---|
| Primary Focus | Behavioral correctness & data accuracy | Throughput, response latency, & stability under load | Vulnerability mitigation, auth validation, & compliance |
| Core Target Metrics | HTTP status codes, JSON schema validation | p95/p99 latency, RPS, TPS, hardware utilization | OWASP Top 10 vulnerabilities, BOLA, rate-limit bypass |
| Execution Phase | Unit, integration, & pull-request checks | Staging deployments & pre-release testing | Continuous vulnerability scans & penetration testing |
| Tooling Ecosystem | Postman, REST Assured, PyTest | k6, JMeter, Locust, Gatling | OWASP ZAP, Burp Suite, Snyk |
| Failure Indication | Assertions fail on incorrect payload values | Response latency breaches defined SLA thresholds | Unauthenticated data access or schema injection |
| Resource Impact | Low compute and network footprint | High memory, CPU, and network resource consumption | Moderate compute impact during security fuzzing |
9. Best Practices for Maintaining High-Performance APIs
Building and maintaining high-performance APIs requires continuous engineering discipline. Incorporate these core operational principles into your team’s development culture:
- Enforce Pagination and Field Masking: Never expose unbounded collection endpoints that return thousands of database records in a single response payload. Default to strict cursor pagination.
- Implement Multi-Layered Caching: Cache aggressive read-heavy data at the edge using Content Delivery Networks (CDNs), at the network layer using API Gateways, and in memory using Redis clusters.
- Optimize Database Queries Continuously: Use automated database query analyzers to identify unindexed lookups, missing foreign key indexes, and slow-executing joins before they impact production users.
- Decouple Dynamic Business Logic: Offload long-running background tasks—such as sending email notifications, generating PDF invoices, or processing video files—to asynchronous background message queues (e.g., RabbitMQ, Apache Kafka, or AWS SQS).
- Set Defensive Timeout Policies: Define strict execution timeouts for internal database calls and external third-party API requests. Prevent downstream dependency stalls from consuming worker threads indefinitely.
- Deploy Circuit Breakers: Wrap external dependencies with circuit breaker patterns (e.g., Resilience4j) to fail fast when third-party services experience outages, protecting your core system from cascading failures.
- Monitor Real-World Telemetry: Continuously compare performance test results against real-user monitoring (RUM) and production application performance telemetry to refine your synthetic test profiles.
Conclusion
System performance is not a static feature that can be added right before a product launch—it is an essential architectural requirement. As applications scale into distributed microservices and process millions of daily transactions, unmonitored API latency quickly becomes a major liability.
By implementing systematic API performance testing—spanning load, stress, spike, and soak profiles—engineering teams can identify system bottlenecks, optimize database query paths, right-size cloud infrastructure, and protect user experiences.
Integrating automated load testing tools like k6 or Locust directly into your CI/CD pipelines creates a resilient quality gate that catches latency regressions early. Combined with strict rate-limiting policies, asynchronous I/O architectures, and continuous observability, performance testing transforms vulnerable web services into highly available, enterprise-grade platforms built to handle modern scale.
Frequently Asked Questions (FAQ)
What is the primary difference between functional API testing and API performance testing?
Functional API testing verifies what an endpoint does—ensuring that it returns the correct status code, payload schema, and business logic for a given input. API performance testing evaluates how fast and reliably the endpoint performs under varying operational traffic loads, measuring parameters such as latency, throughput, CPU utilization, and failure limits.
What is a good baseline response time threshold for enterprise REST APIs?
While specific SLAs vary depending on domain complexity, general enterprise industry benchmarks target a p95 response time under 200 milliseconds for standard read endpoints (GET) and under 500 milliseconds for transactional write endpoints (POST/PUT). Ultra-low latency platforms (such as high-frequency trading or real-time bidding systems) enforce single-digit millisecond thresholds.
Why are arithmetic average response times dangerous in performance testing?
Arithmetic averages obscure extreme latency outliers. For instance, if 95 out of 100 requests complete in 20 milliseconds, but 5 requests take 5,000 milliseconds due to database thread locking, the calculated average response time is approximately 269 milliseconds. This hides the fact that 5% of your user base is experiencing a broken 5-second delay. Relying on p95 and p99 percentiles exposes these critical edge-case slowdowns.
How often should automated API performance tests be executed?
Lightweight performance smoke tests should run automatically on every major pull request or daily CI/CD build to catch latency regressions early. Comprehensive load, stress, and soak testing suites should be executed weekly, prior to major software releases, or ahead of anticipated high-traffic business events.
About the Author