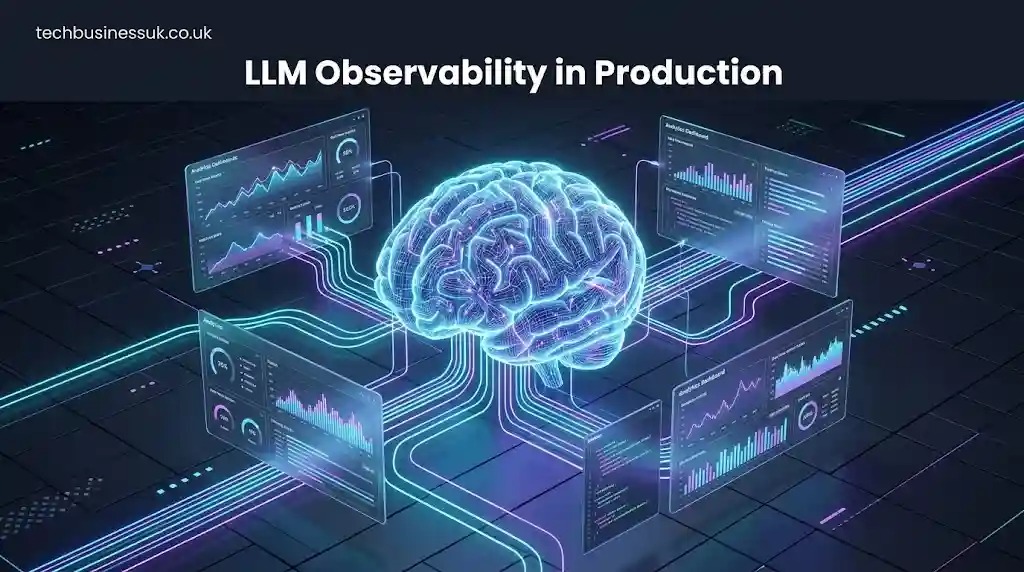
Transitioning Large Language Models (LLMs) from experimental sandbox prompts to mission-critical production environments exposes a fundamental engineering reality: pre-deployment evaluation is necessary, but insufficient. While an llm evaluation framework helps establish baseline capabilities during offline development, real-world user interactions introduce non-deterministic execution paths, adversarial prompt injections, sudden latency spikes, and unpredictable API token consumption. To maintain application reliability, software teams must implement robust llm observability.
Understanding what is LLM observability requires looking beyond traditional APM (Application Performance Monitoring) metrics like CPU utilization or HTTP status codes. In non-deterministic generative applications, a standard $200\text{ OK}$ response can easily mask critical failures—such as silent hallucinations, toxic outputs, or excessive multi-turn agent loops. Comprehensive LLM application monitoring provides end-to-end visibility into every step of execution, capturing input prompts, retrieved context chunks, model reasoning steps, and final completions.
       +-----------------------------------------------------------------+
       |                      USER QUERY INPUT                           |
       +-----------------------------------------------------------------+
                                       |
                                       v
       +-----------------------------------------------------------------+
       |                  INPUT GUARDRAILS & PII MASKING                 |
       +-----------------------------------------------------------------+
                                       |
                   +-------------------+-------------------+
                   |                                       |
                   v                                       v
  +---------------------------------+    +---------------------------------+
  |      VECTOR DATABASE (RAG)      |    |       TOOL / API EXECUTION      |
  |  Retrieval Latency & Relevance  |    |     Function Call & Arguments   |
  +---------------------------------+    +---------------------------------+
                   |                                       |
                   +-------------------+-------------------+
                                       |
                                       v
       +-----------------------------------------------------------------+
       |                  LLM INFERENCE & TOKEN MONITORING               |
       |             (TTFT, Tokens/sec, Model Temperature)               |
       +-----------------------------------------------------------------+
                                       |
                                       v
       +-----------------------------------------------------------------+
       |                 OUTPUT EVALUATION & DRIFT CHECK                 |
       |            (Faithfulness, Groundedness, Toxicity)               |
       +-----------------------------------------------------------------+
                                       |
                                       v
       +-----------------------------------------------------------------+
       |                      FINAL GENERATED RESPONSE                   |
       +-----------------------------------------------------------------+
By adopting formal LLM telemetry standards, engineering organizations can perform deep LLM root cause analysis when responses degrade. Observability enables developers to inspect individual prompt execution spans, measure exact latency breakdowns across retrieval augmented generation (RAG) steps, and enforce budget caps before token overuse impacts bottom-line unit economics. Paired with robust llm api testing, observability completes the operational lifecycle of AI applications.
2. Core Architecture: Tracing vs. Monitoring vs. Evaluation
A common misconception among engineering teams is conflating logging, tracing, monitoring, and evaluation into a single operational concept. Building a production-grade LLM observability platform requires establishing a clean architectural separation across these four distinct pillars:
+-----------------------------------------------------------------------------------+
|                            LLM OBSERVABILITY ARCHITECTURE                         |
+--------------------------+--------------------------+-----------------------------+
|        PILLAR 1          |         PILLAR 2         |           PILLAR 3          |
|    DISTRIBUTED TRACING   |  PERFORMANCE MONITORING  |      REAL-TIME EVALUATION   |
+--------------------------+--------------------------+-----------------------------+
| * Multi-step Spans       * Token Consumption Rates  * Faithfulness Scoring        |
| * RAG Context Chunks     * TTFT & Throughput        * Groundedness & Relevance    |
| * Tool Call Arguments    * System Error Rates (429) * Hallucination Detection    |
+--------------------------+--------------------------+-----------------------------+
Distributed Tracing & Semantic Spans
Traditional distributed tracing records service requests as HTTP spans. In contrast, semantic tracing LLM paradigms capture hierarchical, nested execution trees. A single user query to an autonomous assistant creates a parent span, which splits into multiple child spans: vector database querying, system prompt formatting, model API requests, external function execution, and output guardrail parsing.
Performance & System Monitoring
While tracing analyzes individual execution paths, monitoring aggregates macro-level LLM observability metrics. These dashboards aggregate global system throughput, token consumption rates, API rate limiting occurrences, and model availability across multi-region provider deployments.
Real-Time Production Evaluation
Unlike offline synthetic benchmarking, real-time evaluation continuously scores live production completions against quality, safety, and relevance metrics. This hybrid approach allows teams to monitor user satisfaction without delaying stream responses.
To establish unified telemetry standards across multi-cloud infrastructure, modern architectures adopt OpenTelemetry GenAI semantic conventions. By establishing standard semantic conventions for GenAI telemetry, OpenTelemetry ensures that prompt traces, model parameters, and token counts remain vendor-neutral—preventing lock-in whether deployed on proprietary API gateways or custom Kubernetes clusters.
3. Key Performance, Latency & Token Telemetry Metrics
Optimizing generative AI applications requires balancing performance, model quality, and operational cost. Tracking raw latency alone is insufficient for streaming completions. Instead, engineering teams track a suite of granular performance metrics:
+-----------------------------------------------------------------------------------+
|                        KEY LLM PERFORMANCE & COST METRICS                         |
+-------------------------+---------------------------------------------------------+
| METRIC NAME             | OPERATIONAL SIGNIFICANCE                                |
+-------------------------+---------------------------------------------------------+
| Time to First Token     | Measures initial user-perceived responsiveness during   |
| (TTFT)                  | streaming generation.                                   |
+-------------------------+---------------------------------------------------------+
| Tokens Per Second       | Evaluates model generation speed and raw streaming      |
| Latency                 | throughput performance.                                 |
+-------------------------+---------------------------------------------------------+
| Prompt Token Length     | Tracks input payload size, system prompt overhead, and  |
| Metrics                 | context growth.                                         |
+-------------------------+---------------------------------------------------------+
| Completion Token Usage  | Measures exact output size generated per request for    |
|                         | cost auditing.                                          |
+-------------------------+---------------------------------------------------------+
| Context Window Usage    | Monitors usage percentage relative to maximum token     |
|                         | limits to avoid truncation.                             |
+-------------------------+---------------------------------------------------------+
| Cache Hit Ratio         | Tracks prompt caching efficiency to reduce redundant   |
| Tracking                | inference calls.                                        |
+-------------------------+---------------------------------------------------------+
Understanding time to first token TTFT is crucial for user-facing streaming chat interfaces. A high TTFT indicates bottlenecks during embedding lookup, vector database context retrieval, or initial prompt processing at the provider end. Conversely, tracking tokens per second latency measures generation speed once generation begins. High generation latency points to model parameter constraints or provider server congestion.$$\text{Total Request Latency} = \text{Retrieval Latency} + \text{TTFT} + \left(\frac{\text{Total Output Tokens}}{\text{Tokens Per Second}}\right)$$
Systematic LLM latency monitoring allows teams to set precise operational service level objectives (SLOs). Automated dashboards track prompt token length metrics alongside completion token usage to flag unexpected prompt bloat. Without granular token consumption tracking, context window usage can silently double, drastically increasing execution time.
To maintain sustainable economics, engineering leads rely on a real-time LLM cost tracking dashboard. Setting alert thresholds for LLM token cost optimization prevents runaway expenditure caused by accidental infinite loops or malicious automated scraping. Incorporating LLM cache hit ratio tracking helps ensure repeated user queries return pre-computed cached responses, bypassing inference entirely to optimize LLM cost per user tracking.
Operational metrics must also include token rate limit throttling monitoring and LLM API response time metrics. When provider APIs return HTTP status $429\text{ Too Many Requests}$, api rate limiting strategies help smooth client requests, while LLM streaming latency tracing captures the precise fallback delay to give developers visibility into exponential backoff execution.
4. Quality, Drift, Hallucination Tracking, and Real-Time Evaluation
Monitoring infrastructure metrics ensures system uptime, but observing LLM output quality guarantees application trustworthiness. Generative outputs degrade silently over time due to shifting user inputs, upstream model updates, or outdated contextual data. Preventing this requires continuous online evaluation.
                                +---------------------------+
                                |  LIVE PRODUCTION OUTPUT   |
                                +---------------------------+
                                              |
                     +------------------------+------------------------+
                     |                                                 |
                     v                                                 v
      +-----------------------------+                   +-----------------------------+
      |     GROUNDEDNESS METRIC     |                   |     FAITHFULNESS METRIC     |
      | Is completion supported by  |                   | Does response strictly map  |
      | the retrieved context?      |                   | to source facts?            |
      +-----------------------------+                   +-----------------------------+
                     |                                                 |
                     +------------------------+------------------------+
                                              |
                                              v
                                +---------------------------+
                                |  HALLUCINATION SCORE (0-1)|
                                +---------------------------+
Real-Time Hallucination Detection
Implementing real-time hallucination detection relies on calculating two core metrics: groundedness and faithfulness. Groundedness monitoring assesses whether every claim in the generated output is explicitly supported by context chunks fetched during retrieval. Simultaneously, faithfulness score tracking verifies that the LLM has not extrapolated unsupported assumptions.
Production Drift & Accuracy Scoring
Systematic tracking of production model drift tracking highlights gradual shifts in user interactions or model behavior. When prompt performance degradation occurs, automated pipelines compute an LLM response accuracy scoring index against target gold-standard datasets. Measuring online evaluation metrics side-by-side with offline validation ensures that system updates maintain target accuracy.
Toxicity, Bias, and User Signals
To ensure compliance and brand safety, production platforms continuously run LLM toxicity monitoring alongside bias detection in live LLMs and sentiment shift in LLM outputs. Beyond algorithmic evaluation, platforms must aggregate explicit user feedback. Tracking user feedback thumbs down tracking correlates implicit user rejections with specific prompt traces, accelerating LLM regression monitoring and targeted model fine-tuning.
5. Agentic Workflows & Multi-Step RAG Execution Tracing
As generative AI applications evolve from simple single-turn text completions into multi-step agentic systems, traditional logging approaches break down. Autonomous agents leverage dynamic tool execution, dynamic planning loops, and multi-agent handoffs—making comprehensive tracing indispensable for debugging complex systems.
   [USER QUERY] ---> ( Agent Main Controller )
                            |
         +------------------+------------------+
         |                                     |
         v                                     v
  [Sub-Agent: Web Search]             [Sub-Agent: Python Exec]
         |                                     |
  (Tool Call: Google Search)          (Tool Call: Code Interpreter)
         |                                     |
         +------------------+------------------+
                            |
                            v
                     [FINAL RESPONSE]
Multi-Turn Agent Tracing
In a multi turn agent tracing context, a single user query initiates an extended graph execution. Observability platforms visualize the complete agentic execution graph monitoring flow, capturing every decision point made by the routing model. When using orchestration frameworks like LangGraph, dedicated langgraph agent tracing integrations automatically record node transitions, state changes, and conditional branching logic.
Tool Call & RAG Span Telemetry
Modern agents interact with external data environments through function calling. Tool call execution tracking records input arguments, execution responses, execution times, and payload errors. This granular logging is crucial for function argument extraction tracing, exposing cases where models output malformed JSON or invalid parameter types, where structured api error handling plays a critical role in preventing downstream system crashes.
               [QUERY]
                  |
                  v
       +--------------------+
       |  Vector Embedding  |
       +--------------------+
                  |
                  v
       +--------------------+
       | Context Retrieval  | <--- RAG Retrieval Span Monitoring
       +--------------------+      Vector Search Latency Tracing
                  |                RAG Context Chunk Monitoring
                  v
       +--------------------+
       | Generation Engine  |
       +--------------------+
For RAG architecture pipelines, RAG retrieval span monitoring isolates search efficiency from language model generation speed. Recording vector search latency tracing pinpoints vector database index bottlenecks, while RAG context chunk monitoring analyzes whether retrieved document chunks contained relevant answers or introduced noise.
Agentic Loop and Trajectory Control
Complex workflows with autonomous agents carry operational risks, including infinite loop iterations. By providing real-time agent trajectory visualization, developers can inspect every intermediate step in the reasoning chain. Implementing agent infinite loop detection monitors tool call frequencies, automatically aborting execution loops when sub agent handoff tracking exceeds maximum recursion depth thresholds. This granular visibility simplifies debugging intermediate reasoning step tracing, helping engineers quickly locate broken reasoning logic.
6. Comparative Analysis: Top Open-Source vs. Enterprise LLM Observability Tools
Selecting the right open source LLM observability framework or commercial enterprise platform depends on data privacy requirements, infrastructure hosting preferences, engineering resources, and scalability demands.
+---------------------------------------------------------------------------------------------------+
|                        COMPREHENSIVE TOOL COMPARISON MATRIX                                      |
+------------------+--------------------+---------------------+--------------------+----------------+
| TOOL / FRAMEWORK | DEPLOYMENT TYPE    | PRIMARY FOCUS       | OPEN SOURCE?       | TRACING MODEL  |
+------------------+--------------------+---------------------+--------------------+----------------+
| Langfuse         | Self-Host / SaaS   | Developer-First TRC | Yes (MIT / AGPL)   | OpenTelemetry  |
| Arize Phoenix    | Self-Host / SaaS   | AI Quality & Evals  | Yes (Executable)   | OTEL Native    |
| Datadog LLM      | Managed SaaS       | Infrastructure APM  | Proprietary Agent  | Custom APM     |
| LangSmith        | SaaS / Enterprise  | LangChain Native    | Commercial / Tier  | Custom Spans   |
| Helicone         | Self-Host / SaaS   | Proxy Telemetry     | Yes (Apache 2.0)   | Proxy Wrapper  |
+------------------+--------------------+---------------------+--------------------+----------------+
When evaluating LLM observability tools, engineering teams must choose between self-hosted open-source software and fully managed SaaS platforms. Utilizing established api testing tools alongside dedicated telemetry stacks ensures complete end-to-end coverage. Modern development teams routinely compare top solutions:
Open-Source Developer-Centric Frameworks
- Langfuse: A leading open-source platform designed for developer teams. Integrating the langfuse python sdk enables deep multi-step tracing, explicit prompt management, and automated score logging. Organizations looking to inspect source code can explore the langfuse open source llm observability github repository to review its langfuse open source llm observability tracing capabilities.
- Arize Phoenix: Focused on evaluation, evaluation accuracy, and notebook-based debugging. Phoenix runs natively inside local Python environments or via containerized deployments. Developers can inspect the arize phoenix llm observability documentation for setup details, or follow the arize phoenix llm observability docs to run an arize phoenix docker deployment within private VPC environments.
Enterprise Infrastructure Platforms
- DataDog LLM Observability: Extends existing application performance monitoring into generative AI pipelines. Datadog llm observability aggregates host telemetry, API rates, and model performance metrics into unified IT operations dashboards.
- LangSmith: Built by the creators of LangChain, offering seamless state tracing, dataset curation, and continuous evaluation for production agent applications.
- Helicone: Operates as a lightweight API proxy layer. Incorporating helicone llm observability requires changing only a single base URL string in your SDK configuration, making it fast to deploy for token cost tracking and caching.
For specialized use cases, teams often combine lightweight frameworks with platforms like weights and biases prompts, truera trulens observability, honeycomb llm tracing, dynatrace llm monitoring, or new relic genai observability to maintain comprehensive operational visibility across their tech stack.
7. Security, Compliance, Guardrails, and Risk Prevention
Observability in generative applications extends beyond performance monitoring—it plays a vital role in application security and data privacy. LLMs process unvalidated user input, making them vulnerable to novel security exploits that standard web firewalls cannot detect.
       [UNTRUSTED USER INPUT]
                 |
                 v
  +------------------------------+
  |  System Prompt Leakage Check |
  +------------------------------+
                 |
                 v
  +------------------------------+
  |   Jailbreak Attempt Logging  |
  +------------------------------+
                 |
                 v
  +------------------------------+
  | Prompt Injection Detection   |
  +------------------------------+
                 |
                 v
  +------------------------------+
  |   PII Masking & Privacy Logs |
  +------------------------------+
                 |
                 v
       [CLEANSED LLM PROMPT]
Threat Monitoring and Attack Surface Defense
Implementing real-time prompt injection detection monitoring helps identify malicious prompts designed to bypass application controls. Observability dashboards capture jailbreak attempt logging patterns, giving security teams the visibility needed to patch system prompts against adversarial manipulation. Continuous tracking of system prompt leakage monitoring guarantees that proprietary internal instructions remain secure.
Privacy, PII Protection, and Compliance
Handling sensitive user information requires strict privacy controls. Integrating automated pii leakage tracking llm systems sanitizes personal identifiers (e.g., social security numbers, credit card details, API tokens) before payloads are transmitted to external model providers. Establishing a complete audit trail for genai provides full data provenance, ensuring compliance with global regulatory standards like the EU AI Act compliance monitoring guidelines.
Guardrails and Defensive Logging
Modern enterprise architectures deploy defense-in-depth guardrail systems (such as NeMo Guardrails or Llama Guard) to filter inputs and outputs. Observability tools record every guardrail trigger monitoring event, logging instances where queries were blocked or modified. Maintaining comprehensive llm safety filter logs allows security teams to audit rejected inputs, refine content moderation rules, and evaluate adversarial prompt monitoring effectiveness without impacting user experience.
8. DevOps, Continuous Integration, and Production Deployment Pipeline
Integrating observability into modern DevOps workflows requires embedding continuous monitoring directly into build, deployment, and testing pipelines. Applying consistent practices ensures system stability when deploying generative applications at scale within a robust pipeline architecture.
+-----------------------------------------------------------------------------------+
|                        DEVOPS CI/CD OBSERVABILITY PIPELINE                        |
+-----------------------------------------------------------------------------------+
|  [CODE COMMIT] --> [CI / CD EVAL GATES] --> [CANARY DEPLOYMENT]                   |
|                            |                        |                             |
|                            v                        v                             |
|                    (Offline Evals)          (OTEL Middleware)                     |
|                            |                        |                             |
|                            +-----------+------------+                             |
|                                        |                                          |
|                                        v                                          |
|                         [PRODUCTION PROMETHEUS / GRAFANA]                         |
+-----------------------------------------------------------------------------------+
Middleware and Framework Integrations
Embedding tracing directly into API gateways simplifies telemetry capture across all microservices. Building a custom fastapi llm tracing middleware or using custom Express middleware allows developers to capture incoming request payloads, model configurations, and response spans automatically:
from fastapi import FastAPI, Request
import time

app = FastAPI()

@app.middleware("http")
async def trace_llm_requests(request: Request, call_next):
    start_time = time.time()

    # Process incoming payload and capture user context
    response = await call_next(request)

    duration = time.time() - start_time
    # Export metrics (TTFT, Latency, Status) to OpenTelemetry Collector
    print(f"Path: {request.url.path} | Duration: {duration:.4f}s | Status: {response.status_code}")
    return response
Deploying production logging for llms involves aligning system architecture with OpenTelemetry GenAI semantic conventions, ensuring telemetry remains structured and standardized across services.
Monitoring Infrastructure and Alerts
For teams leveraging open-source monitoring platforms, setting up prometheus metrics for llm exported spans allows for visual tracking on a custom grafana dashboard for openai api. Systems should automatically monitor for llm error status 429 monitoring events, triggering automated failover logic to alternative model endpoints when provider rate limits are hit:
                  [PRIMARY LLM PROVIDER]
                            |
                 (HTTP 429 Rate Limited?)
                            |
           +----------------+----------------+
           | YES                             | NO
           v                                 v
[FALLBACK MODEL PROVIDER]          [NORMAL RESPONSE]
Tracking fallback provider execution tracking guarantees that automatic provider switches maintain strict operational reliability across the entire continuous monitoring llm pipeline.
9. Enterprise Market Landscape, Strategic ROI, and Cost Management
Evaluating the llm observability platform market landscape requires software leaders to balance functional capabilities against total cost of ownership (TCO). As enterprise adoption grows, observability evolves from a technical convenience into a critical driver of business efficiency and cost control.
+-----------------------------------------------------------------------------------+
|                      ENTERPRISE LLM STACK OBSERVABILITY LAYER                      |
+-----------------------------------------------------------------------------------+
|  APPLICATION LAYER : Chat Interfaces, Copilots, Agentic Workflows                 |
|  OBSERVABILITY LAYER: Tracing, Evaluation, Cost Optimization, Security Logging    |
|  INFRASTRUCTURE    : Model Hosting, Vector Databases, API Gateways                |
+-----------------------------------------------------------------------------------+
Strategic Value & ROI
Investing in enterprise llm observability delivers clear financial and operational returns. Real-time token usage insight enables llm telemetry cost reduction strategies—such as routing simpler queries to smaller, more efficient models or implementing semantic response caching. High llm application reliability minimizes downtime, builds user trust, and protects revenue streams. Complementing this with what is api monitoring provides holistic operational visibility across both traditional microservices and AI workloads.
                     +----------------------------------+
                     | Total Cost Savings Engine        |
                     +----------------------------------+
                                      |
         +----------------------------+----------------------------+
         |                                                         |
         v                                                         v
[Semantic Prompt Caching]                               [Intelligent Query Routing]
Bypasses LLM inference for                              Routes simple queries to smaller,
frequently asked questions.                             low-cost models automatically.
Selection Criteria for Enterprise Leaders
When selecting llm observability vendor platforms, evaluation teams should evaluate four primary criteria:
- Deployment Architecture: Can the solution run as a self hosted llm observability deployment within private cloud environments to satisfy compliance requirements?
- Integration Breadth: Does the tool natively integrate with existing APM setups, database layers, and deployment pipelines?
- Customization: Does it allow engineering teams to build a tailored custom dashboard for llm apps that displays key business metrics alongside system telemetry?
- Market Momentum: Staying informed on llm observability news helps ensure the chosen platform stays aligned with evolving OpenTelemetry standards and ecosystem developments.
By embedding an observability layer into the core llm stack observability layer, enterprises achieve measurable llm observability ROI, turning raw operational data into actionable system optimizations.
10. Implementation Playbook & Practical Guide
Deploying a production-ready observability architecture requires a systematic implementation strategy. This step-by-step operational playbook helps development teams transition from basic logging to comprehensive telemetry in real-world environments.
+-----------------------------------------------------------------------------------+
|                         IMPLEMENTATION PLAYBOOK PHASES                            |
+-----------------------------------------------------------------------------------+
|  PHASE 1: Instrumentation & OTEL Semantic Conventions Standard                    |
|  PHASE 2: Telemetry Pipeline Routing & Secret Sanitization                        |
|  PHASE 3: Real-Time Evaluators & Hallucination Guardrails                          |
|  PHASE 4: Cost Control, Alerting Thresholds & Fallback Circuit Breakers            |
+-----------------------------------------------------------------------------------+
Phase 1: Standardize Telemetry Instrumentation
- Implement OpenTelemetry GenAI semantic conventions across all API gateways, microservices, and agent orchestration layers.
- Wrap model calls with unified SDK interceptors to capture prompt inputs, token counts, model parameters, and completion outputs.
Phase 2: Secure & Sanitize Telemetry Streams
- Configure client-side PII scrubbing filters to mask credit card numbers, personal identifiers, and secret keys prior to trace export.
- Ensure log persistence complies with regional regulatory frameworks, including GDPR and EU AI Act mandates.
Phase 3: Deploy Online Real-Time Evaluators
- Configure asynchronous evaluation tasks to measure groundedness, faithfulness, and answer relevancy without adding latency to streaming client responses.
- Set up automated triggers for user rejection signals (e.g., thumbs-down feedback) to automatically flag traces for root cause analysis.
Phase 4: Configure Cost & Operational Alerts
- Establish threshold alerts for token burn rates, TTFT spikes, and
$429\text{ Too Many Requests}$rate-limiting occurrences. - Connect observability alerts directly to circuit breakers, enabling automatic fallback model routing when primary provider APIs experience degraded performance.
Following this structured playbook ensures that your LLM application remains performant, secure, cost-effective, and fully observable as user traffic scales.
About the Author

4 thoughts on “LLM Observability in Production: Tracing, Tools, and Monitoring”